The Canvas
<canvas id="example" width="150" height="150"></canvas>The <canvas> element has only two attributes, width and height.
When no width and height attributes are specified, the canvas will initially be 300 pixels wide and 150 pixels high.
Providing fallback content is very straightforward: just insert the alternate content inside the <canvas> element.
Browsers that don't support <canvas> will ignore the container and render the fallback content inside it.
Browsers that do support <canvas> will ignore the content inside the container, and just render the canvas normally.
We could provide a text description of the canvas content...
or provide a static image of the dynamically rendered content
Сontext
The <canvas> element creates a fixed-size drawing surface that exposes one or more rendering contexts, which are used to create and manipulate the content shown.
The canvas is initially blank. To display something, a script first needs to access the rendering context and draw on it.
The <canvas> element has a method called getContext(), used to obtain the rendering context and its drawing functions. getContext() takes one parameter, the type of context.
var canvas = document.getElementById('example');
var ctx = canvas.getContext('2d');
The first line in the script retrieves the node in the DOM representing the <canvas> element.
Once you have the element node, you can access the drawing context using its getContext() method
var canvas = document.getElementById('example');
if (canvas.getContext) {
	var ctx = canvas.getContext('2d');
 	// drawing code here
} else {
	// canvas-unsupported code here
}
A simple example
function draw() {
var canvas = document.getElementById('canvas');
if (canvas.getContext) {
var ctx = canvas.getContext('2d');
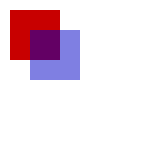
ctx.fillStyle = 'rgb(200, 0, 0)';
ctx.fillRect(10, 10, 50, 50);
ctx.fillStyle = 'rgba(0, 0, 200, 0.5)';
ctx.fillRect(30, 30, 50, 50);
}
}
Drawing shapes with canvas
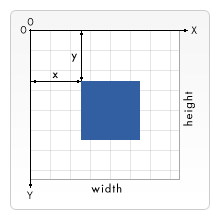
The grid
Drawing shapes with canvas
Drawing rectangles
There are three functions that draw rectangles on the canvas:
fillRect(x, y, width, height) — Draws a filled rectangle.
strokeRect(x, y, width, height) — Draws a rectangular outline.
clearRect(x, y, width, height) — Clears the specified rectangular area, making it fully transparent.
Each of these three functions takes the same parameters. x and y specify the position on the canvas (relative to the origin) of the top-left corner of the rectangle. width and height provide the rectangle's size.
function draw() {
var canvas = document.getElementById('canvas');
if (canvas.getContext) {
var ctx = canvas.getContext('2d');
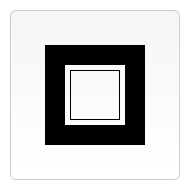
ctx.fillRect(25,25,100,100);
ctx.clearRect(45,45,60,60);
ctx.strokeRect(50,50,50,50);
}
}
Drawing shapes with canvas
Drawing paths
Path is a list of points, connected by segments of lines that can be of different shapes, curved or not, of different width and of different color.
To make shapes using paths, we take some extra steps:
- First, you create the path.
- Then you use drawing commands to draw into the path.
- Once the path has been created, you can stroke or fill the path to render it.
Here are the functions used to perform these steps:
beginPath() — Creates a new path. Once created, future drawing commands are directed into the path and used to build the path up.
closePath() — Adds a straight line to the path, going to the start of the current sub-path.
stroke() — Draws the shape by stroking its outline.
fill() — Draws a solid shape by filling the path's content area.
- The first step to create a path is to call the beginPath().
- The second step is calling the methods that actually specify the paths to be drawn.
- The third, and an optional step, is to call closePath(). This method tries to close the shape by drawing a straight line from the current point to the start.
function draw() {
var canvas = document.getElementById('canvas');
if (canvas.getContext) {
var ctx = canvas.getContext('2d');
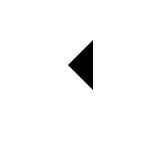
ctx.beginPath();
ctx.moveTo(75, 50);
ctx.lineTo(100, 75);
ctx.lineTo(100, 25);
ctx.fill();
}
}
moveTo(x, y) — Moves the pen to the coordinates specified by x and y.
When the canvas is initialized or beginPath() is called, you typically will want to use the moveTo() function to place the starting point somewhere else.
lineTo(x, y) — Draws a line from the current drawing position to the position specified by x and y.
This method takes two arguments, x and y, which are the coordinates of the line's end point. The starting point is dependent on previously drawn paths, where the end point of the previous path is the starting point for the following, etc.
arc(x, y, radius, startAngle, endAngle, anticlockwise) — Draws an arc which is centered at (x, y) position with radius r starting at startAngle and ending at endAngle going in the given direction indicated by anticlockwise (defaulting to clockwise).
arcTo(x1, y1, x2, y2, radius) — Draws an arc with the given control points and radius, connected to the previous point by a straight line.
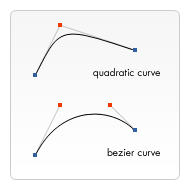
quadraticCurveTo(cp1x, cp1y, x, y)
bezierCurveTo(cp1x, cp1y, cp2x, cp2y, x, y)
Draws a quadratic and a cubic Bézier curve from the current pen position to the end point specified by x and y, using the control points specified by (cp1x, cp1y) and (cp2x, cp2y).
Path2D objects
Path2D() — The Path2D() constructor returns a newly instantiated Path2D object, optionally with another path as an argument (creates a copy), or optionally with a string consisting of SVG path data.
Path2D.addPath(path [, transform]) — Adds a path to the current path with an optional transformation matrix.
Applying styles and colors
Colors
fillStyle = color — Sets the style used when filling shapes.
strokeStyle = color — Sets the style for shapes' outlines.
Transparency
globalAlpha = transparencyValue — Applies the specified transparency value to all future shapes drawn on the canvas. The value must be between 0.0 (fully transparent) to 1.0 (fully opaque). This value is 1.0 (fully opaque) by default.
Line styles
lineWidth = value — Sets the width of lines drawn in the future. Values must be positive numbers. By default this value is set to 1.0 units.
Line styles
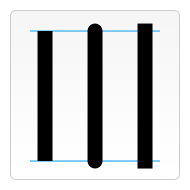
lineCap = type — Sets the appearance of the ends of lines. There are three possible values for this property and those are: butt, round and square. By default this property is set to butt.
Line styles
lineJoin = type — Sets the appearance of the "corners" where lines meet. There are three possible values for this property: round, bevel and miter. By default this property is set to miter.
Line styles
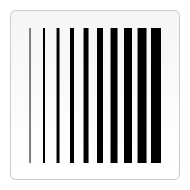
setLineDash(segments)
lineDashOffset = value
The setLineDash method and the lineDashOffset property specify the dash pattern for lines. The setLineDash method accepts a list of numbers that specifies distances to alternately draw a line and a gap and the lineDashOffset property sets an offset where to start the pattern.
Gradients
createLinearGradient(x1, y1, x2, y2) — Creates a linear gradient object with a starting point of (x1, y1) and an end point of (x2, y2).
Gradients
createRadialGradient(x1, y1, r1, x2, y2, r2) — Creates a radial gradient. The parameters represent two circles, one with its center at (x1, y1) and a radius of r1, and the other with its center at (x2, y2) with a radius of r2.
Shadows
shadowOffsetX = float
shadowOffsetY = float
Indicates the horizontal and vertical distance the shadow should extend from the object. This value isn't affected by the transformation matrix. The default is 0.
Shadows
shadowBlur = float — Indicates the size of the blurring effect; this value doesn't correspond to a number of pixels and is not affected by the current transformation matrix. The default value is 0.
shadowColor = color — A standard CSS color value indicating the color of the shadow effect; by default, it is fully-transparent black.
Drawing text
fillText(text, x, y [, maxWidth]) — Fills a given text at the given (x,y) position. Optionally with a maximum width to draw.
strokeText(text, x, y [, maxWidth]) — Strokes a given text at the given (x,y) position. Optionally with a maximum width to draw.
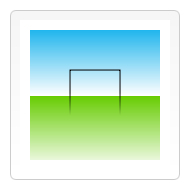
Using images
Importing images into a canvas is basically a two step process:
- Get a reference to an HTMLImageElement object or to another canvas element as a source. It is also possible to use images by providing a URL.
- Draw the image on the canvas using the drawImage() function.
Drawing images
drawImage(image, x, y) — Draws the CanvasImageSource specified by the image parameter at the coordinates (x, y).
Scaling
drawImage(image, x, y, width, height) — This adds the width and height parameters, which indicate the size to which to scale the image when drawing it onto the canvas.
Slicing
drawImage(image, sx, sy, sWidth, sHeight, dx, dy, dWidth, dHeight) — Given an image, this function takes the area of the source image specified by the rectangle whose top-left corner is (sx, sy) and whose width and height are sWidth and sHeight and draws it into the canvas, placing it on the canvas at (dx, dy) and scaling it to the size specified by dWidth and dHeight.
Basic animations
These are the steps you need to take to draw a frame:
- Clear the canvas
- Save the canvas state
- Draw animated shapes
- Restore the canvas state
Controlling an animation
setInterval(function, delay) — Starts repeatedly executing the function specified by function every delay milliseconds.
setTimeout(function, delay) — Executes the function specified by function in delay milliseconds.
requestAnimationFrame(callback) — Tells the browser that you wish to perform an animation and requests that the browser call a specified function to update an animation before the next repaint.
Browser compatibility
- Mozilla applications gained support for <canvas> starting with Gecko 1.8 (Firefox 1.5).
- The element was originally introduced by Apple for the OS X Dashboard and Safari.
- Internet Explorer supports <canvas> from version 9 onwards; for earlier versions of IE, a page can effectively add support for <canvas> by including a script from Google's Explorer Canvas project.
- Google Chrome and Opera 9 also support <canvas>.
The HTML5 Canvas Handbook
HTML5 CANVAS CHEAT SHEET
HTML Canvas 2D Context
HTML5 canvas tutorials